I'm curious how many people are capturing data from the BCU with openlogger or something similar, and what they're doing with it. I know there are a few of us doing so, and I'm working on a web-based tool for myself to plot out the various data. I have some ideas for the tool and would be more than willing to put some real work and make it available somehow, but not if there's no interest.
This is a typical plot that it generates so far: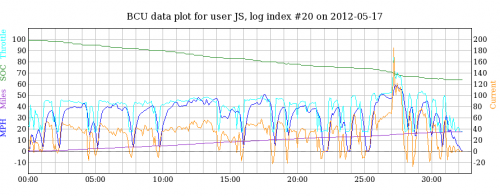
(Sorry it's hard to read; it gets scaled down when I upload the image. MPH, Miles, SOC and Throttle are on the left axis, with Current on the right.)
Personally, I think it would be cool if CMC had a user community section on their website where owners could upload their data (or with the production scooters, volunteer to make it publicly available). People considering buying a CMC scooter could look at actual owner data and compare it to their own situation.
Just a thought.


Jon,
This looks great. We will be adding a community section at some point. I haadn't thought about the idea of sharing the data this way - but that's a great idea. Thanks!
I vote for you developing a tool! :-) I have an in-house one that I use - and I know some folks want it - but I never quite get around to packaging it in a form suitable for distribution.
One very important point! you need to change your signature.... ;-)
John H. Founder of Current Motor Company - opinions on this site belong to me; not to my employer
Remember: " 'lectric for local. diesel for distance" - JTH, Amp Bros || "No Gas.
I capture logging data and would love to be able to understand and interpret it.
LeThala, MS Excel or similar open source programs can be a first starting point for beginning to visualize and understand your logged data. But with Excel things tend to end at 65536 data points...
My rides:
2017 Zero S ZF6.5 11kW, erider Thunder 5kW
What I'm working on is actually a web-based tool, where any CMC owner could upload their data, look at other users data, see interesting statistics, etc. I can do all that with my own data, but it's more interesting the more data there is.
What I have so far:
By 'interesting', I mean things like
I've got all those things worked out already, including the graph that I showed a sample of above. What I still need to work on is
I also need to determine how best to make this available if there's interest. Right now I'm doing my development on an old netbook with a Celeron processor, 512MB or RAM and 2GB of disk; the load scripts take a few minutes to import a log for a 30 minute ride, but displaying the web page or graphs is sub-second so the hardware requirements are minimal. I would also need to make it accessible to other folks; I'd rather not open up my home connection for direct internet access, but I might consider that for a proof of concept. I would also be willing to pay to put it up through an ISP with its own domain (cmcowners.org perhaps?), but again only if there's interest.
I'm open to comments & suggestions.
And I agree that you can generate graphs with Excel, but I ran into the problems MEroller discussed; with samples taken every quarter second, there's a lot of datapoints in a BCU log, and it's hard to get Excel to chart anything interesting (at least for me).
Jon Stibal
2008 EVT America Z-20A
2011 CMC C130 - my daily driver:
I think this is a worthwhile project. I'll help. I'm a Java developer and I may have a hosting account lying around idle that we could use. If someone could post vhat the column values mean, that would help me alot. Up to now I've just been forwarding my log files to John.
LeThala,
A lot of the fields I don't know what they represent, and I suspect that they're irrelevant to me for the most part; things like kick stand status, charge door status, left and right brake status, etc. I haven't bothered to reverse engineer those, but here's the field definitions I believe I do know (any field labled f# or F# is a placeholder for a field I don't know):
"f0","Time", "State","f3","f4","f5","f6","f7","f8","f9","f10","F11","F12","pack_v","cell_v","throttle",
"temp_1","temp_2","temp_3","temp_4","current","F21","speed","trip","F24","SOC",
"F26","F27","F28","F29","F30","F31","mileage"
It might make more sense to look at it from the database definitions (I'm just cutting and pasting from my SQL script):
F0 char(4) NOT NULL DEFAULT "",
bcu_time time NOT NULL DEFAULT "00:00:00",
state char(20) NOT NULL DEFAULT "",
F3 char(4) NOT NULL DEFAULT "",
F4 char(4) NOT NULL DEFAULT "",
F5 char(4) NOT NULL DEFAULT "",
F6 char(4) NOT NULL DEFAULT "",
F7 char(4) NOT NULL DEFAULT "",
F8 char(4) NOT NULL DEFAULT "",
F9 char(4) NOT NULL DEFAULT "",
F10 char(4) NOT NULL DEFAULT "",
F11 char(20) NOT NULL DEFAULT "",
F12 char(4) NOT NULL DEFAULT "",
pack_v decimal(5,2)NULL DEFAULT "0.00",
cell_v decimal(4,2) NOT NULL DEFAULT "0.00",
throttle decimal(5,2) NOT NULL DEFAULT "0.00",
temp_1 decimal(5,2) NOT NULL DEFAULT "0.00",
temp_2 decimal(5,2) NOT NULL DEFAULT "0.00",
temp_3 decimal(5,2) NOT NULL DEFAULT "0.00",
temp_4 decimal(5,2) NOT NULL DEFAULT "0.00",
current_draw decimal(5,2) NOT NULL DEFAULT "0.0",
F21 char(4) NOT NULL DEFAULT "",
speed decimal(4,2) NOT NULL DEFAULT "0.00",
trip decimal(5,2) NOT NULL DEFAULT "0.00",
F24 char(4) NOT NULL DEFAULT "",
SOC decimal(5,2) NOT NULL DEFAULT "0.00",
F26 char(4) NOT NULL DEFAULT "",
F27 char(4) NOT NULL DEFAULT "",
F28 char(4) NOT NULL DEFAULT "",
F29 char(4) NOT NULL DEFAULT "",
F30 char(4) NOT NULL DEFAULT "",
F31 char(4) NOT NULL DEFAULT "",
mileage decimal(8,2) NOT NULL DEFAULT "0.00"
I haven't figured out which temperatures go with which sensors, but I think I have an idea in general what areas the sensors are for (battery, power lead, motor, controller)
I'd be more than happy to collaborate on this, although I have one rule: you can't laugh at my code (derisive snickers are OK). I'm a tinkerer/hack, not a professional; I do stuff with the LAMP stack as an amusement.
Unless someone else pipes in that they'd like to collaborate, maybe we can start an email chat to discuss logistics and code. Let me know what you think.
Jon Stibal
2008 EVT America Z-20A
2011 CMC C130 - my daily driver:
Guys,
Here's column headers in a comma separated value format:
Time(seconds),TimeStamp,Status,DoorOpen,FrontBrake,RearBrake,LowSpeed,ReverseSwitch,SideStand,LVC,Moving,Kelly,ErrorCode,Pack Voltage(V),Avg Cell Voltage(V),Throttle In(%),Motor Temp(C),Lead Temp(C),Pack Temp 1(C),Pack Temp 2(C),Running Amps(A),Charging Amps(A),Speed(MPH),Distance(Miles),Throttle Control(%),SoC(%),ChargeRelay,DC-DC,ReverseEnable,KellyEnable,FactoryMode,Regen Control(%),Power(kW)
See if that matches up with what you are seeing.
My electric vehicle: CuMoCo C130 scooter.
MikeB,
Other than the first and last fields, that matches up perfectly. Of the BCU data I've loaded into MySQL (30 logs, 766K rows), the first field is always a "D" and the last field appears to be total mileage. It could be a difference in BCU version; I think I was the last test pilot to receive their scooter, and mine's been back to CMC for the ugpraded charger plus replacing some bad cells in March/April so the BCU may have been updated.
Regardless, this is excellent data to have; thank you! Now that we have an idea of what the temperature readings are for, I might add an option to show those on the graph as well.
Jon Stibal
2008 EVT America Z-20A
2011 CMC C130 - my daily driver:
OK, I have a workable proof of concept up on a free hosting website:
http://cmcowners.comze.com/bcuplot.php
I only have my data right now, but if anyone wants me to upload their data please send me an email and we can work out the details. If there's interest, I'll work on allowing people to load their own data through a web interface (the upload script is written, but needs to be changed to work from a web page).
The data is 2 second averages of the BCU logs, since the 4 samples per second that the BCU captures is too granular to plot meaningfully. I've tried to put as much critical data in the charts as possible, with an option to add secondary data like pack voltage, temp reading, throttle position, etc.; I don't want the chart to be so busy that it's impossible to read. (Apologies to anyone who's color-blind; it may be hard to discern which line represents what data. I'm open to suggestions on that if it's an issue).
If it's not obvious when looking at the chart, the second graph at the bottom is a representation of various on/off conditions over time: front brake, rear brake, low speed switch, LVC. I only added those items I thought were important when riding, and left things out like 'charge door open'.
I'd like to add a user profile section as well (geography, typical ride, personal stats, favorite ride, etc.), but I thought it more important to start with the actual BCU data. I'm sure there are lots of things that I haven't thought of or included, but this should be a reasonable start.
Jon Stibal
2008 EVT America Z-20A
2011 CMC C130 - my daily driver:
Jon,
This is very impressive! I hope others will upload their data.
Excellent work.
John H.
John H. Founder of Current Motor Company - opinions on this site belong to me; not to my employer
Remember: " 'lectric for local. diesel for distance" - JTH, Amp Bros || "No Gas.
Very nice. I'll send you some data from my next batch.
I had an idea last night and had some time today at lunch, so I added a page of 'widgets' that can be used to embed images generated from the BCU database. If you check my signature (at least as of now), the image embedded there is generated directly from the database on the website. The same page can be used to generate an image of a particular riders top speed. For either one, all you have to do is pass it the rider number and the option you want (SPEED or MILEAGE).
I have a page of samples at http://cmcowners.comze.com/sample.php.
As always, if there's interest, there are probably lots of cools things we could do with the data. I'm just throwing things against the wall to see what will stick, in the hopes that perhaps we can build a better and more interesting user community for ourselves.
Jon Stibal
2008 EVT America Z-20A
2011 CMC C130 - my daily driver:
Maybe it's because I'm an old fart, but, unless the Higgs Boson or the the origin of Dark Energy Quintessence and the Cosmological Constant ("forty two!") is lurking amongst those comma-separated values, I really can't see the fascination with the BCU data. Back when I needed to troubleshoot some things on the scooter, I downloaded a sampling of BCU data using this convenient serial data-to-file app (or just review it on the BCU configure/control software provided to test pilots), but otherwise it seems a bit anorak-ish, like trainspotting, to me. (John, maybe you can translate...)
By the way, when the test pilot scooters get their final upgrades, will the BCU configuration/data application still work?
PJD,
I agree that looking through the CSV output of the BCU logs is difficult; that's why I thought that a utility to generate a graph would be useful. For instance, in the graph for my longest ride:
I can see that from three minutes until almost eleven minutes, as I was driving down M-140 at just under 50 MPH, I was only drawing about 33A. I find that interesting, as on my last scooter I would have been drawing 70A to hold 35 MPH. Then at twenty-seven minutes into the ride as I got onto I-94, I hit 66.97 MPH, drawing almost 170A with the pack voltage dipping to 90V (the only way for my last scooter to reach 66 MPH would have been in freefall).
It's probably just me, but I like looking at this stuff, and trying to figure out how I can improve my ride efficiency, optimize my charge patterns (I'm a believer in using the middle 60% of a Lithium battery), etc. I also think it would be useful for someone considering purchasing a C130 to know that a 6'7", 280lb guy (305lb with gear & luggage) can drive 21 miles at around 50 MPH and peaking at 66 MPH, and only use up half the range of the battery pack (this ride started at 90% SoC, as it was the second part of my commute that morning).
But I seem to like tilting at windmills; I do it all the time (anyone need a few hundred 'Ron Paul 2008' flyers?). I'll not be offended if the overall reaction is a resounding 'meh'. It's cost me nothing monetarily and I learned some new programming techniques that I'm certain I can use later. But maybe someone will find it useful, or be inspired to build something better/cooler/prettier. I'm just throwing ideas out there so that those of us who have these scooters can better share & compare what we've learned.
Jon Stibal
2008 EVT America Z-20A
2011 CMC C130 - my daily driver:
Jon - let us windmill tilters of the world unite (but you can keep your RP flyers!) !!
I hope that your pages and widgets do gain traction. Maybe 1 in 10 riders might appreciate it?
But if they go "meh" then oh well there's always other windmills :-)
John H. Founder of Current Motor Company - opinions on this site belong to me; not to my employer
Remember: " 'lectric for local. diesel for distance" - JTH, Amp Bros || "No Gas.
Wow! That surprised me. But then I looked and you were reading the wrong scale you were drawing 66A...
John H. Founder of Current Motor Company - opinions on this site belong to me; not to my employer
Remember: " 'lectric for local. diesel for distance" - JTH, Amp Bros || "No Gas.
Ah, was just thinking: "A MIRACLE SCOOTER!" :-)
I for my part would also see myself as a windmill tilter in this respect, as I also enjoy analyzing the "analogger" data I occasionally log from my CA. Maybe it IS an engineer's geeky thing to do - and I AM an engineer :-)
My rides:
2017 Zero S ZF6.5 11kW, erider Thunder 5kW
Blergh. I should have double checked that before I posted it; 33A for 50 MPH should have set off alarm bells. But still, it tells me I'm running at about 1 C to hold that speed, which means I'm being quite kind to my battery pack.
And interest in this type of data could be an 'engineer' thing as MEroller suggests; I have a paper around here somewhere that says I graduated with an enginering degree, although I certainly wouldn't claim to be one at this point in my career.
Jon Stibal
2008 EVT America Z-20A
2011 CMC C130 - my daily driver:
Jon, thanks for uploading my log. It was interesting to see the data from my rides. I have have some requests. You mentioned you are working on adding the ability to upload logs. If you do that', is it possible to have the date field take an arbitrary string? I''d rather track by charge cycle than by date. That information is more useful and the date of the ride may be tmi. Also it would be useful to be able to enter the number of kilowatt hours used out of the wall for each charge cycle to measure total energy efficiency of the system and also ambirnt temperature for each ride to see how that effects overheating and performance.
The site looks great. I wish this data were available from other bikes. It would be very interesting to be able to compare.
John
John,
Considering you represent 50% of the existing users, I think we can make some adjustments to accommodate you. :) Strictly speaking, I don't need the date at all; the rider and ride numbers are what uniquely identify the data from a particular ride. If you think it's too revealing to have the date, I can remove that easily enough (or at least not show it by default). Would you want some sort of free-form comment area for the ride, a pick list for day of the week designation, or something entirely different?
I'll see what I can work up. I already have a table with one row for every log that I use to record interesting stats, so it shouldn't be too hard to allow someone to add some comments or designations of their choosing for a given log. The tricky bit will be determining the best way to handle user security, authentication & authorization. I typically use LDAP authentication, but I doubt that my free service provider has that. I'll have to write something to take care of that, so perhaps if it's just you and me I'll just use htaccess for now and trust you to upload and edit your own entries, rather than writing a full blown AAA enabled administration webapp right now.
Jon Stibal
2008 EVT America Z-20A
2011 CMC C130 - my daily driver:
I have rudimentary logfile upload & process pages done. I was out of town for a while, so I haven't had time to add any of the new stuff John asked for, plus I want to add error checking and some more logic to the log processing, but it's there and it works now. If anyone wants access to upload their own log files, send me a email or private message, and I'll set you up with a user ID and password to use the new pages.
Jon Stibal
2008 EVT America Z-20A
2011 CMC C130 - my daily driver:
Jon, if you would like, I would be happy to give you a more capable server here at the university provided that you don't mind students combing through it for data mining. I've been working on a local parser / viewer but have not had time to fully DB it up and would be happy to collaborate to help out.
Aaron, I'd be happy for the assistance. I have no issues with your students reviewing my code or data (or making improvements?); I'll have to ask LeThala whether he minds having his data reviewed. I sent you a private message yesterday, but I thought I should respond here as well; I'll try sending you an email later so that we can discuss it outside of the forum.
While I'm posting, I might as well address a few updates I made to the site:
As long as there's interest, I'll keep plugging away at it. I'm still working on the items LeThala requested, but if there's other things people would like to see, let me know.
Jon Stibal
2008 EVT America Z-20A
2011 CMC C130 - my daily driver:
I've been on vacation but I'm back. I'm happy to see more interest in this project. I think it's great for students to have access to this kind of data. This information will lead to more reliable and more efficient electric vehicles with more range and a better driving experience. I wish other scooter manufacturers provided the same data access so people could compare.
Very cool, I'm out for the next week and a half but I'll get some of my students cracking on finding a server and such. I particularly like the odometer blurb in the sig :)
I've made some more changes to the site. I've rewritten the user and data management, giving the rider the ability to do the following themselves:
I've also tried to incorporate some of LeThala's requests by adding the following:
You can see these things for my rider ID, #34. With all the additional data, the main display page is getting a bit busy; I may need to figure out a way to clean it up or reformat it. I'm debating whether to show a table of every ride, with key data and comments, for a given rider on the main site. It can get rather long (I have 98 rides under my ID), and wasn't sure that it made sense despite it being the best way to see all the ride comments.
In order that it can more easily be moved to a new home I've also removed the use of htaccess and password files, and done everything I can to ensure that it's not evil.
The new admin page can be accessed at http://cmcowners.comze.com/admin.php. The public test user ID of '0' is still active.
Jon Stibal
2008 EVT America Z-20A
2011 CMC C130 - my daily driver:
I went to the sire to upload data and it's asking for a username and password.
That should read 'site'.
And I thought you were referring to TheLaird LOL!
My rides:
2017 Zero S ZF6.5 11kW, erider Thunder 5kW
LeThala,
I sent you your username and password via email quite some time ago. I haven't seen any update; did you not get it?
Jon Stibal
2008 EVT America Z-20A
2011 CMC C130 - my daily driver: